Skip to content
New issue

Have a question about this project? Sign up for a free GitHub account to open an issue and contact its maintainers and the community.

By clicking “Sign up for GitHub”, you agree to our terms of service and privacy statement. We’ll occasionally send you account related emails.

Already on GitHub? Sign in to your account

Timezone support for mute timings #48508

Closed
armandgrillet opened this issue Apr 29, 2022 · 7 comments · Fixed by #68813
Closed

Timezone support for mute timings #48508

armandgrillet opened this issue Apr 29, 2022 · 7 comments · Fixed by #68813

Comments

@armandgrillet
Copy link
Contributor

armandgrillet commented Apr 29, 2022

What means "Monday" if I'm based in Sidney? It means that I will not have alerts muted during my Monday morning.
PS 2022-04-29 à 11 37 30

On the engineering side, mute timings are taken care of by the alertmanager within Grafana which is based on the Prometheus Alertmanager and it also doesn't have this feature.

@armandgrillet armandgrillet added area/frontend area/ux area/alerting/unified needs investigation for unconfirmed bugs. use type/bug for confirmed bugs, even if they "need" more investigating labels Apr 29, 2022
@tennox
Copy link

tennox commented May 6, 2022

Have you verified that your TZ environment variable is set correctly? (if you are using a hosted instance)

Disclaimer: I have no knowledge of grafana's code and cannot asses if it might be a bug on their side 💁‍♂️

@tennox
Copy link

tennox commented May 6, 2022

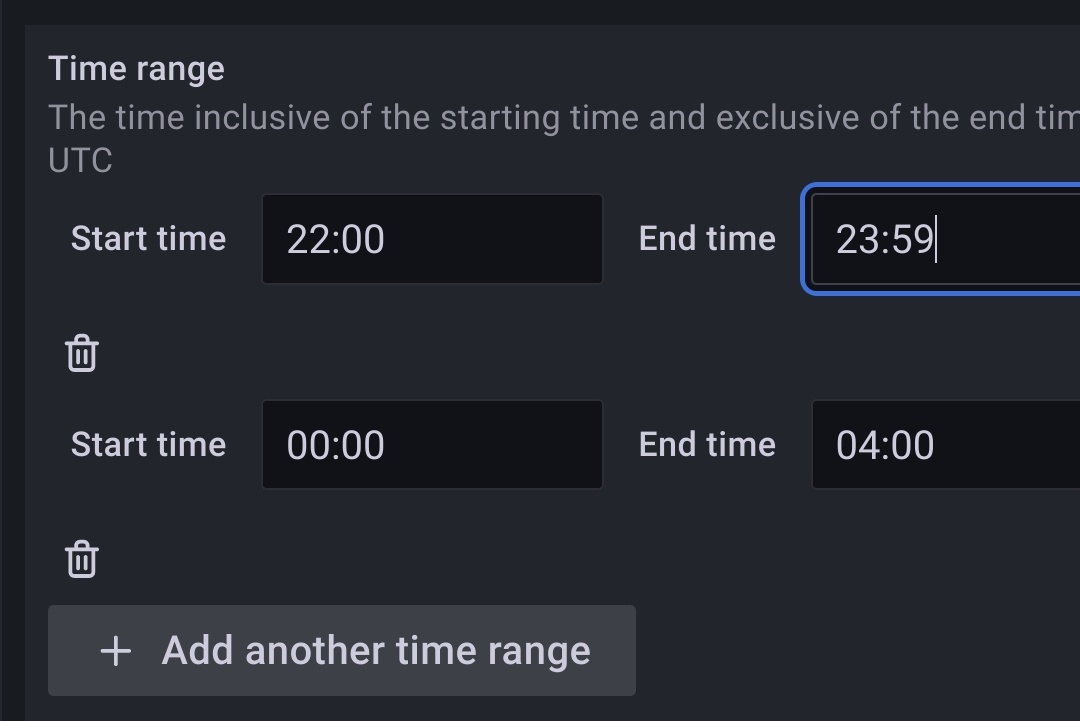
Then again, trying it myself - I do see some issues with it:

dc exec grafana date
Sat May  7 00:46:49 CEST 2022

And tried a mute timing from 0:00-6:00 - and was awoken at 0:15 😓

Then I had to fiddle my way around dubious UI error Snackbars "Error: Bad request data" (which meant to tell me that 00:00 wasn't valid as end time - granted, I should've known this, but the error wasn't telling me in which section of the settings I have an error, so it took me a while :/ )
Screenshot_20220507-004154__01

... I will write again >= tomorrow night if that wasn't my issue

@brunobastosg
Copy link

Same problem here. I have a mute timing from 00:00 to 07:00. Under Preferences, timezone is set to America/Sao_Paulo (UTC-3).

However, I start receiving alerts daily at 4:00.

Right now I'll change the mute timings to take the timezone into account, but it would be great to have this feature.

@armandgrillet armandgrillet added area/alerting Grafana Alerting and removed area/alerting/unified labels Jun 22, 2022
@KyrumX
Copy link

KyrumX commented Sep 7, 2022

This feature would be nice to have. Especially when DST kicks in.

@sathieu
Copy link
Contributor

sathieu commented Mar 29, 2023

This has been done in alertmanager with prometheus/alertmanager#2782.

Porting should be possible.

@gillesdemey gillesdemey removed the needs investigation for unconfirmed bugs. use type/bug for confirmed bugs, even if they "need" more investigating label Apr 3, 2023
@zackman0010
Copy link

This would be nice to have to handle DST. As a workaround currently, I'm expanding the range so that my desired range will always be covered, just with one extra hour on either the front or back depending on DST.
Example: For midnight through two in CST, midnight would be 06:00 UTC and two would be 08:00 UTC. In CDT, they are 05:00 UTC and 07:00 UST. So the time I end up setting is 05:00 UTC - 08:00 UTC. This translates to 23:00-02:00 CST and 00:00-03:00 CDT, which covers my desired range of 00:00-02:00 in both CST and CDT. However, it would be much more convenient to just be able to use time zones.

@dsaintilma-flinks
Copy link

This would welcomed as a new feature.

Sign up for free to join this conversation on GitHub. Already have an account? Sign in to comment
Projects
Archived in project
Development

Successfully merging a pull request may close this issue.

9 participants